Summary
Coupling strength between two missense mutations (e.g., whether there is any epistasis) is strongly correlated with backbone distance, and that these effects were centered at zero (unlike single mutations, which are mostly destabilizing). By that, it means how far from additivity the effect of two mutations are, relative to introducing them individually. This has also been observed in antibodies (1).
Details
From (2)
“…backbone distance is almost perfectly correlated with coupling strength when averaging energy terms per residue pair (Spearman’s ρ = -0.94, Fig 4, with detectable differences even at separation distances greater than 10 residues”
Figures
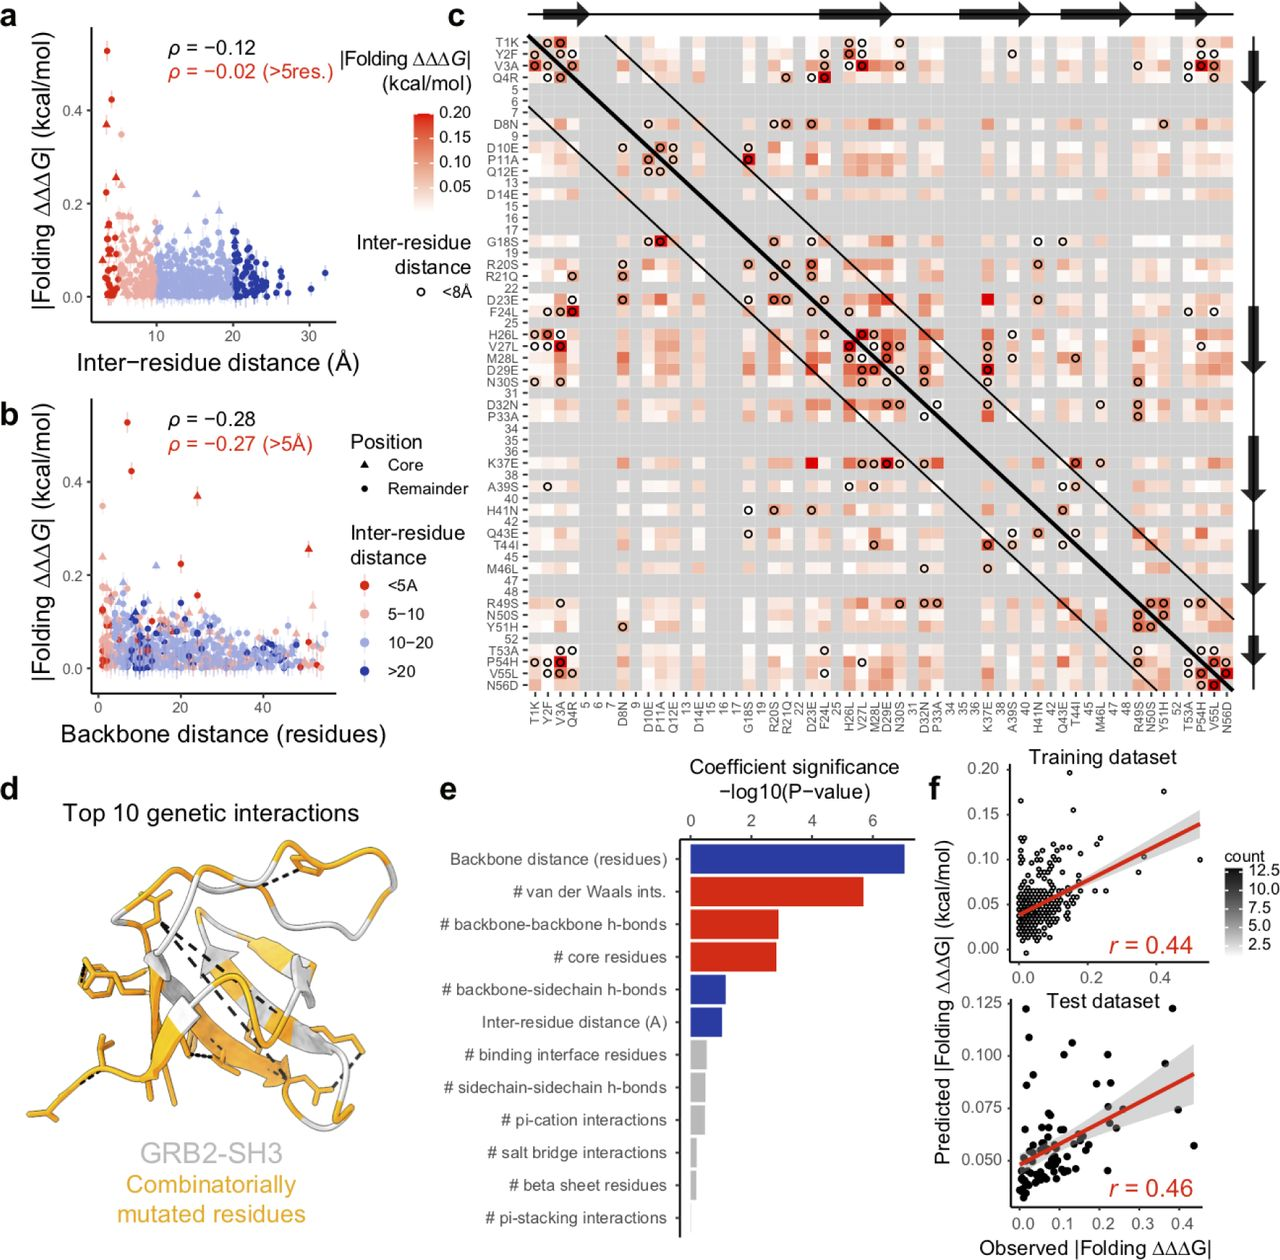
Structural determinants of energetic couplings inferred from combinatorial mutagenesis. a, Relationship between folding coupling energy strength and minimal inter-residue side chain heavy atom distance. Error bars indicate 95% confidence intervals from a Monte Carlo simulation approach (n = 10 experiments). Points are coloured by binned inter-residue distances (see legend in panel b). Spearman’s ρ is shown for all couplings as well as those involving pairs of residues separated by more than five residues in the primary sequence (red). Core residues are indicated as triangles. b, Relationship between folding coupling energy strength and linear sequence (backbone) distance in number of residues. c, Interaction matrix indicating folding coupling strength as well as pairwise structural contacts in GRB2-SH3 (PDB: 2VWF, minimal side chain heavy atom distance < 8 Å, black circles). Gray cells indicate missing values (non-mutated residues) and constitutive single aa substitutions are indicated in x- and y-axis labels. Black diagonal lines demarcate residue pairs that are distal in the primary sequence (backbone distance > 5 residues). Reference secondary structure elements (arrow, β-strand) are shown at top and right. d, 3D structure of GRB-SH3 (PDB: 2VWF) indicating the top 10 energetic couplings with black dashed lines. Combinatorially mutated residues are shown in orange. e, Bar plot showing ranked features from linear model to predict folding coupling strength. Bar width indicates coefficient significance. Blue, positive coefficient; red, negative coefficient; gray non-significant (nominal P > 0.05). f, Correlation between linear model predicted and observed folding coupling strength for training (top) and test data (bottom). Pearson’s r is shown.
Figure and caption from (2)

Ref (1) showing this effect in antibodies